Gautam successfully defended his Master Thesis, “Improving memory reclamation techniques in Hypervisors using Persistent Memory,” this week. Great job!
Tag Archives: students
Dr Kamal
Creative graphing
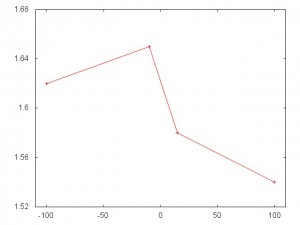
Most graphs use zero for the origin of the X and Y axes. In a some cases, it is better to use a different origin. Because this is unusual, the present should take care to note the atypical origin in order to not confuse or fool the audience. In some cases, those who fail to do this fool themselves. Case in point, consider the graph below, which appeared here.

This appears to show a big difference. Until you look at the y-axis and see that the difference between the high and low is 0.11 posts/day. This is about a 7% over all change, which may be significant. But the graph is highly misleading.
To prove the point a facsimile of the original graph is presented below.
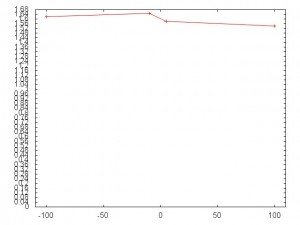
And here it is with 0 as the origin of the Y-axis.![]()
As noted above, this variation of 0.11 posts/day may be significant. But the unzoomed plot gives a better understanding of the magnitude of the change.
Kamal to present at BPOE-4 workshop at ASPLOS
Chin-Jung Hsu passes 890 exam
Chin-Jung Hsu, PhD student, passed his Written Prelim Exam (890). He presented his original work “Flow Scheduling: An Effcient Scheduling Method for MapReduce Framework in the Decoupled Architecture.”
Congratulations!


